πα½
Wed, 22 Jan 2020 07:20:43 +0200
..
Sun, 23 Oct 2022 22:18:03 +0200
Solar and sunspot videos
This is just prepared to explain little more...
Education preview videos:
(I'm not going to explain that much more now... It's short knowledge and art without words...)
That artistically-looking multi-color is my version of sharpened Planckian Mapping, sometimes older PM-NAFE+DoG
(Planckian Mapping, Noise Adaptive Fuzzy Equalization, Difference of Gaussians sharping)
But if you look for Art in Science, ask about prof. Druckmuller, he invented that PM-NAFE algorithm and it's much nicer...
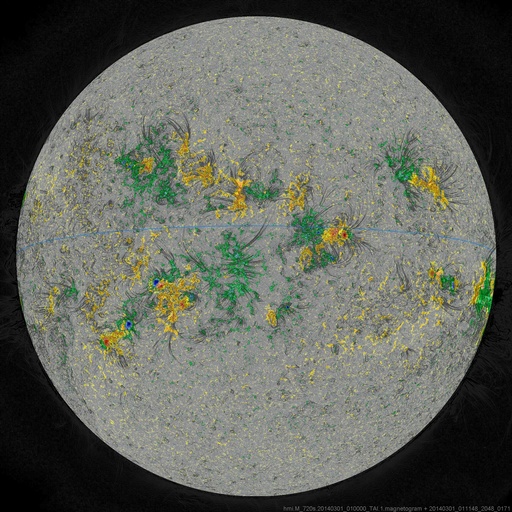
What is a Sunspot and how are it's colors related?
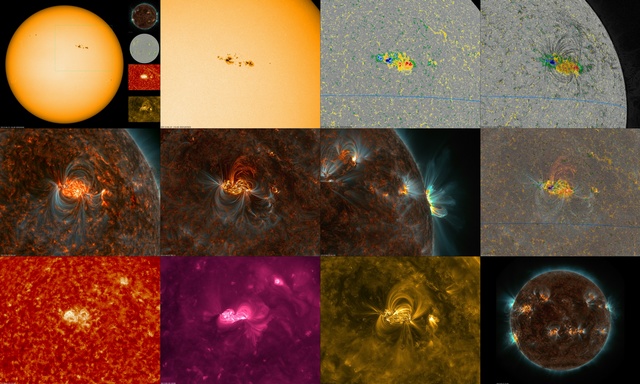
201304_O3_1280x1024_8Mbps_ver221019a.mp4
(mp4 164 Mb, 03:16 = cca 3 minutes)
(jpg 4x3, large)
(From SDO - Solar Dynamics Observatory, yellow is visible HMII,
yellow-green on gray background is magnetogram HMIB,
red is EUV (extreme ultra-violet) 304 A, purple is EUV 211 A, yellow is EUV 171 A from SDO/AIA,
brown is 304+171+211 A from AIA combined by Planckian Mapping,
colors encode temperature with light-blue most hot somewhere arround 1e5 °K,
and there is combined Magnetogram+PM sequence)
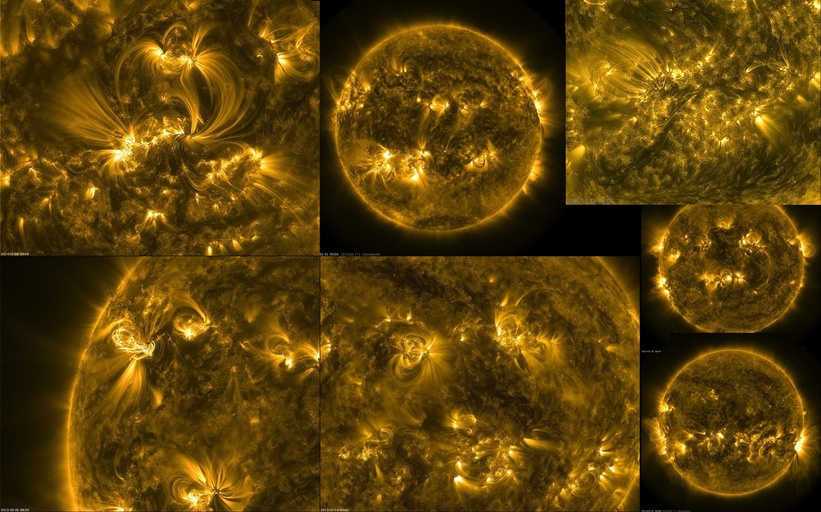
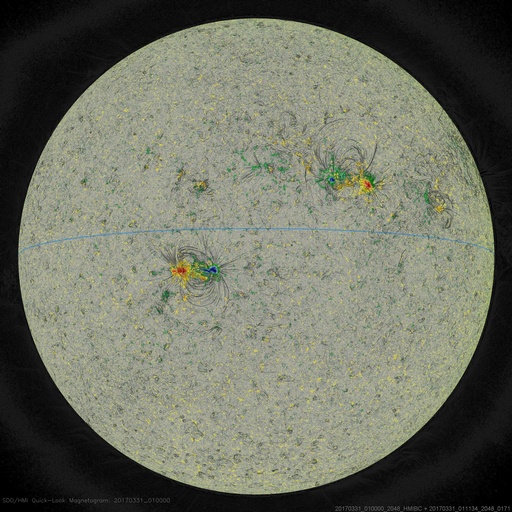
Another active region in 2012 with nice view of magnetic loops...
Mixed with Magnetogram and Intensitygram:

20120112-20120131_Mix_1280x1024_v3.mp4
(mp4 150Mb, 5 minutes)
(jpg 5x2 large)
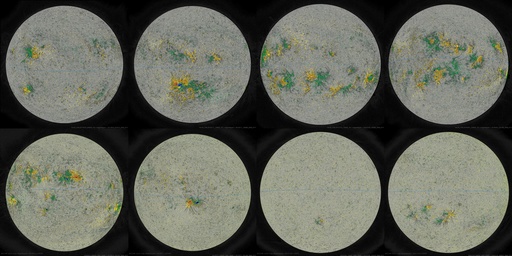
Combined video from SDO/HMIB and SDO/AIA 171,211,304
showing relation of sunspots to magnetic loops (December 2020):
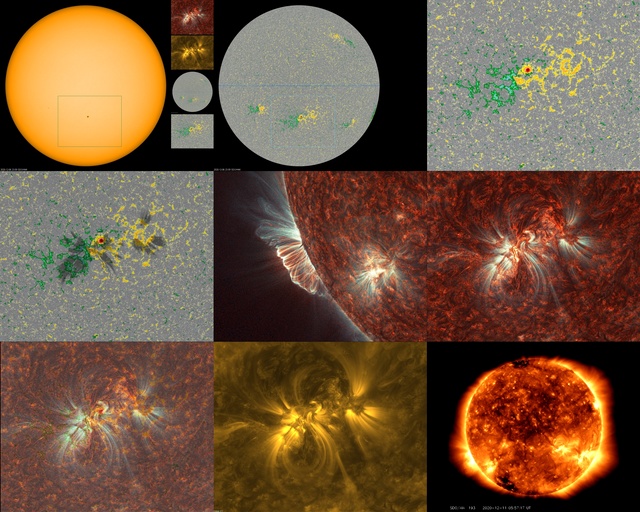
202012_Combined_1280x1024_8Mbps_v9.mp4
(mp4 317Mib, 5:48 = 6 minutes)
(jpg 3x3, large)
I've published another set of SDO/AIA 171 videos at
sun.smilingtree.cz ...
(2021-03-26)
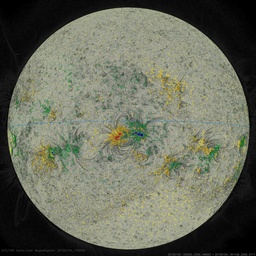
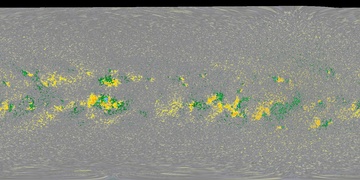
And here is a Magnetic Map of Sun showing surface flow of differential rotation and an evolution of a Sunspot Cycle...
The past maps, of cause, because it is an alive map...
Some part is as viewed, and some part is just interpolated...
(It's continual...)
(That is a science, how to "see" on other side of Sun... In interpolation later (after the next turn), but it is not perfect... Better would be to send there Stereo2 soon enough, the "cosmic fireworks" already started... Elon Musk is probably fastest in development of space-ships...? And the missions should always overlap to compare differences and callibrate...)
Cycle SC23 and SC24 magnetic intensity compared:
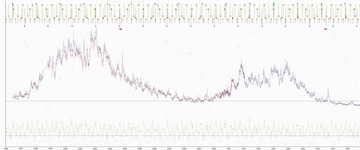
(
PNG,
XML)
Magnetic field
(positive and negative) from SOHO and SDO spacecrafts combined
on interpolated synoptic maps, removing the "single-face" problem.
(SOHO values are scaled by 0.67 to match on the overlapping region).
Arrows at top are various syzigies of Jupiter, Venus and Earth.
Curves at bottom are simple sum of tidal forces onto Sun and Earth's angular momentum changes...
Rotation curve is measured
(publication is pending),
and an "alive" part can be used to verify it...
(Note a difference between sunspot (dis)appearing on front and far side)
Note, that in SC 23 (1996-2008), sunspots on northern hemisphere are
green (positive) on right (leading) side
and yellow (negative) on left (trailing) side,
and on southern hemisphere it is opposite,
and in SC 24 (2010-2020) it is opposite, with sunspots on northern hemisphere
yellow (negative) on right (leading) side
and green (positive) on left (trailing) side,
and on southern hemisphere it is opposite...
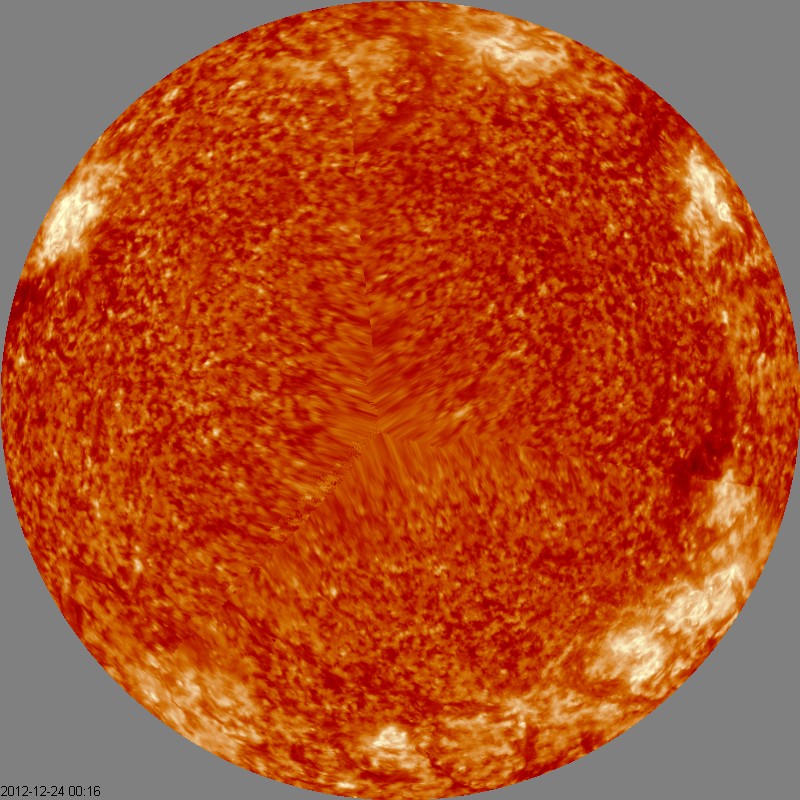
A synoptic video of SC24 from 304A channel combined from SDO and Stereo spacecrafts, with far-side retained in history
(without applying differential rotation):
(
PNG,
XML)
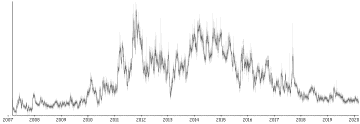
Average / Median - indicator of cycle intensity without a "single-face" problem of Solar rotation...
(Difference between 2008 and 2018 shows an estimate of error in absolute value
due to calibration problems in SDO...)
(Image data in floating-point numeric format are available on request at semi(at)pialpha(dot)cz ...)
 Solar Cycle 25 Started on Remarkable Times ...
(A significant update to this work is pending...)
And note - there are not "old news" on Sun, but archives are being combed,
not erased... At least 1-hour precision should be retained from very long time ago...
(Hřebenová metoda...)
---------
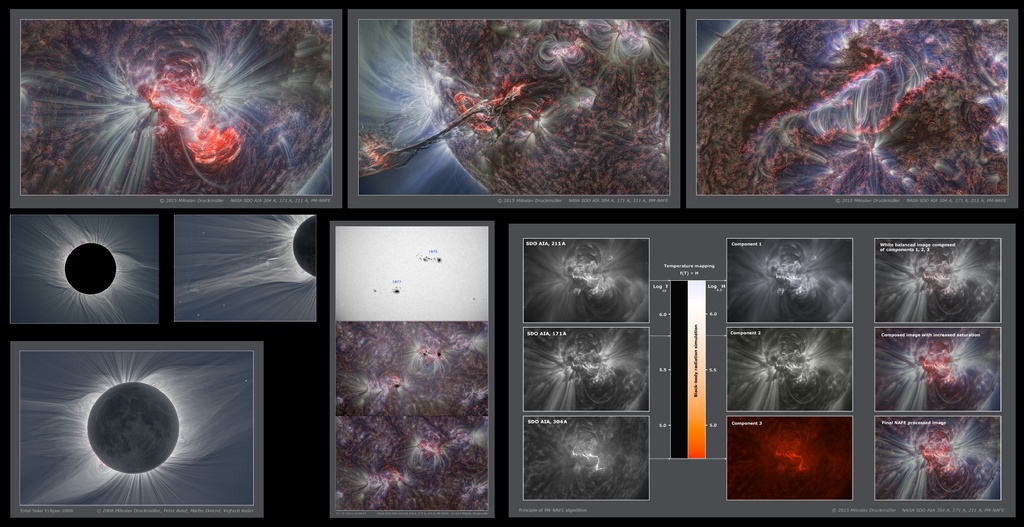 And a link to professor Druckmuller with a sample of, what really is "Art in Science"...
***** (I'll try to ask later, if it matters, that I publish it like this... And I'm not "Everyone" and I can be somehow cheeky...)
A sample from PM NAFE, a sample from eclipse...
The NAFE video is art and science, because the colors express temperatures...
The Eclipse is art and science, and it is not repeatable and even NASA cannot do this from space...
(There is much more on his web-page, this is just my illustrative selection)
-------
Můj nápad:
A nejlepší ze stážistů u professora D. z Brna s ním bude moci jet
s batůžkem přes půl planety a tisíc kilometrů s jeepem, aby tam nafotil také zatmění,
ale také aby tam nafotil deset obrázků oblohy v noci se stejnou optikou...
Protože to tím zkalibruje...
I jpeg se dá změřit na decipixel, ale každá optika a chip zanáší o kus a každá jinak,
ale hvězdy jsou zkatalogizované na "mas" (milli arc second)...
Aby tam těch hvězd bylo tak max 100 ale rozhodně ne 10000...
A nevím, kolik se jich do jeepu vejde, ale měli by se zálohovat a být tam aspoň dva nebo víc.
Také atmosféra zanáší opticky, a to závisí na teplotě, takže to v noci není stejné, jako přes den...
Ale to se dá podchytit výpočetně...
Nebo to nafotit při půlce zatmění rovnou, místo focení Slunce, prostě s tím hnete stranou o dost...
Což je škoda z těch 4 minut zatmění kus nemít, ale bude vás tam víc a jen někdo to takhle změří...
Proč je dosud nejpřesnější, co změřili Einsteinovi v roce 1919 ?
Je potřeba to změřit přesněji, o kolik to ohýbá světlo kolem Slunce a kde...
A na to je potřeba Eclipse, kde budou dobře hvězdy daleko od Slunce i pár blízko...
(Stačí jich na uchycení v rohu na každé straně pár, a pár doprostřed na změření...)
Což se musí vyhlédnout, která Eclipse je na tohle vhodná, protože ty ani jedna nejsou stejné...
Je to na pár minut neopakovatelný výkon, pro který je potřeba hodně dřiny...
A někde si půjčit "Optiku" (dalekohled,foto,notebook,...)
Což vám někdo půjčí, když jste nadějný...
On tam starší profesor jezdit nemusí sám, on si na to vychová Lidi...
P.A.Semi - πα½, updated 2022-10-23


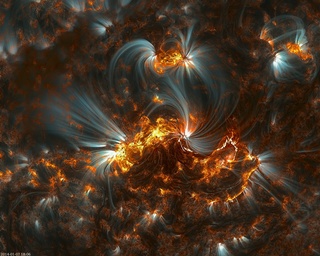


 Polar view SC24 (mp4 118mb, 05:16)

 (PNG,
XML)
 Solar Cycle 25 Started on Remarkable Times ...
(A significant update to this work is pending...)
And a link to professor Druckmuller with a sample of, what really is "Art in Science"... ***** (I'll try to ask later, if it matters, that I publish it like this... And I'm not "Everyone" and I can be somehow cheeky...) A sample from PM NAFE, a sample from eclipse... The NAFE video is art and science, because the colors express temperatures... The Eclipse is art and science, and it is not repeatable and even NASA cannot do this from space... (There is much more on his web-page, this is just my illustrative selection) ------- Můj nápad: A nejlepší ze stážistů u professora D. z Brna s ním bude moci jet s batůžkem přes půl planety a tisíc kilometrů s jeepem, aby tam nafotil také zatmění, ale také aby tam nafotil deset obrázků oblohy v noci se stejnou optikou... Protože to tím zkalibruje... I jpeg se dá změřit na decipixel, ale každá optika a chip zanáší o kus a každá jinak, ale hvězdy jsou zkatalogizované na "mas" (milli arc second)... Aby tam těch hvězd bylo tak max 100 ale rozhodně ne 10000... A nevím, kolik se jich do jeepu vejde, ale měli by se zálohovat a být tam aspoň dva nebo víc. Také atmosféra zanáší opticky, a to závisí na teplotě, takže to v noci není stejné, jako přes den... Ale to se dá podchytit výpočetně... Nebo to nafotit při půlce zatmění rovnou, místo focení Slunce, prostě s tím hnete stranou o dost... Což je škoda z těch 4 minut zatmění kus nemít, ale bude vás tam víc a jen někdo to takhle změří... Proč je dosud nejpřesnější, co změřili Einsteinovi v roce 1919 ? Je potřeba to změřit přesněji, o kolik to ohýbá světlo kolem Slunce a kde... A na to je potřeba Eclipse, kde budou dobře hvězdy daleko od Slunce i pár blízko... (Stačí jich na uchycení v rohu na každé straně pár, a pár doprostřed na změření...) Což se musí vyhlédnout, která Eclipse je na tohle vhodná, protože ty ani jedna nejsou stejné... Je to na pár minut neopakovatelný výkon, pro který je potřeba hodně dřiny... A někde si půjčit "Optiku" (dalekohled,foto,notebook,...) Což vám někdo půjčí, když jste nadějný... On tam starší profesor jezdit nemusí sám, on si na to vychová Lidi...