Iso (contour) maps
[ ]
(If you want to download most or all of these maps, use ZIP link on right...)
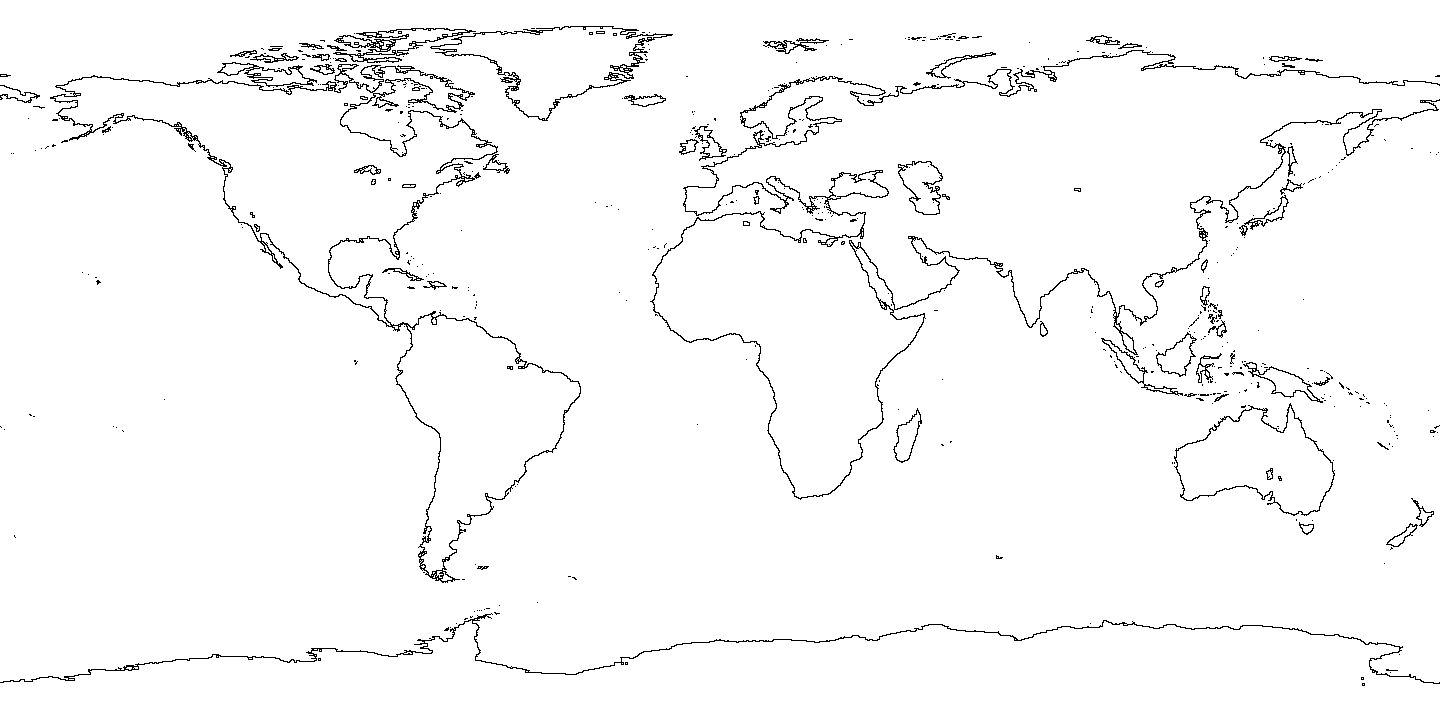
Sometimes I need land contour map in rectangular projection to draw over
maps produced from other data...
In order, that the lines are not too thin when downscaling too much,
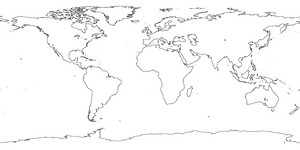
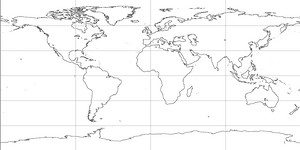
best seems 1440x720 pixel resolution... Other resolutions are also available:
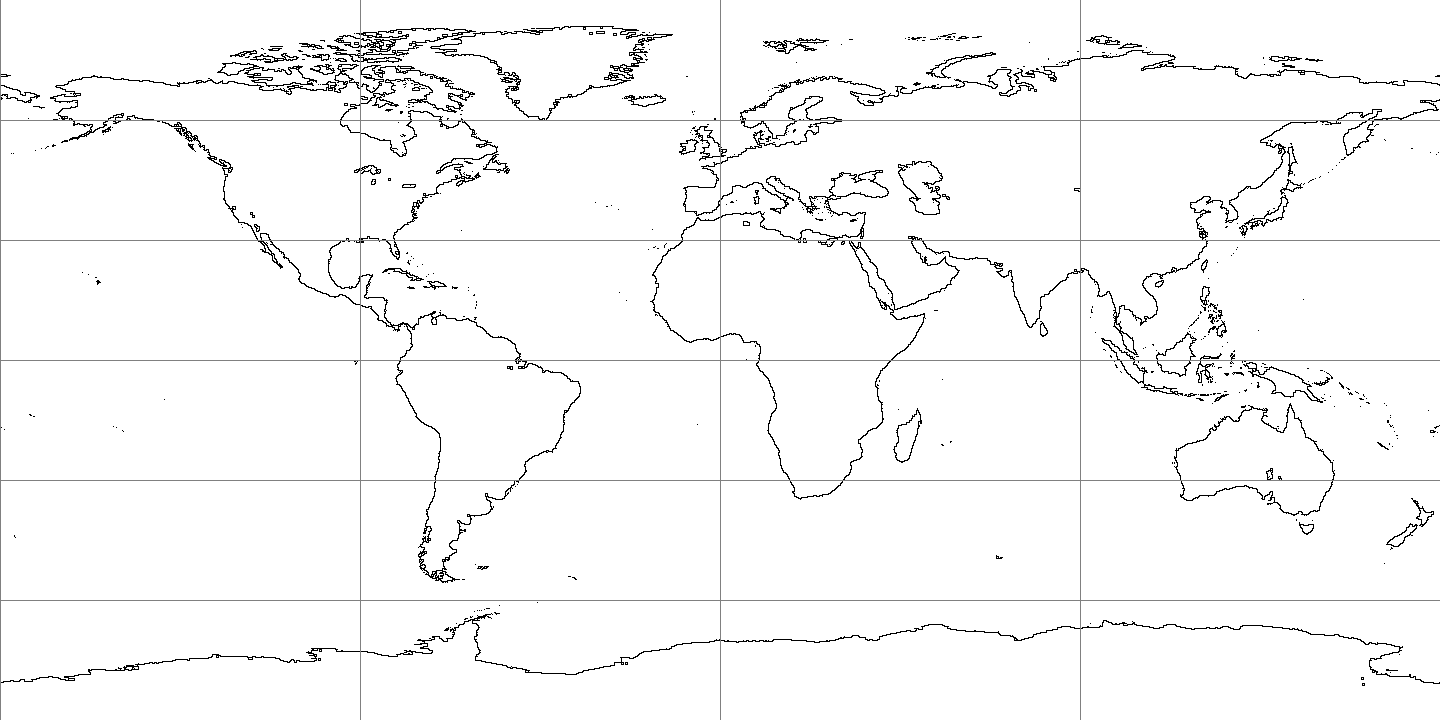
Map with lines (90° east-west, 30° north-south):
Map with each 1000 m iso contours:
Map with only 1000 and 2000 iso contours:
Large map with each 500 m iso contours:
Map in Mollweide projection with two polar circles in Lambert Azimutal projection:
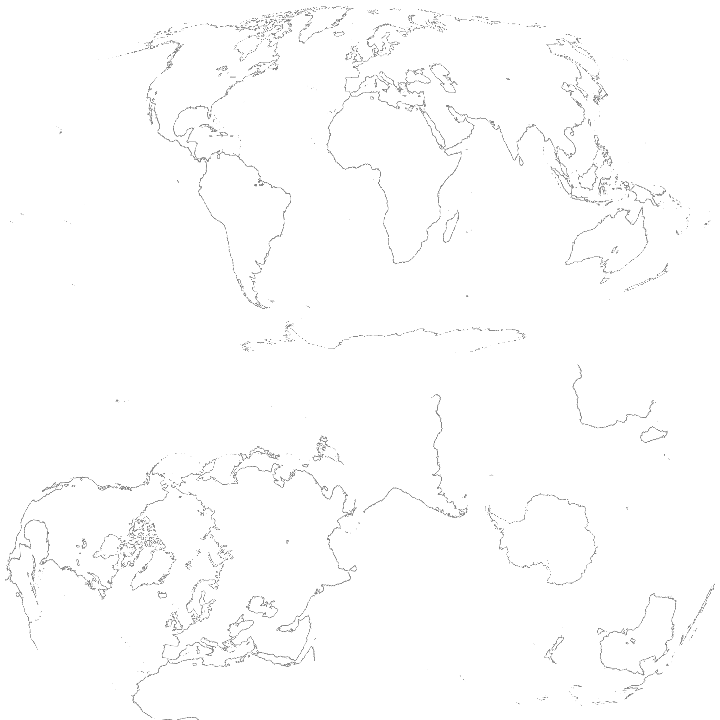
These maps were produced by Eval script:
#include MapUtil
var Out:='etopo1_ice_IsoMap_Moll2Pol_1024px.png';

var F:=NFm(2048,1024); // new FloatMap
F.Fill(1);

var Clr:=new DataScale();
Clr.AddRange(0,'#000000');
Clr.AddRange(1,'#ffffff');

HmrToMoll2Pol({Source:F,Target:Out,DataScale:Clr,MollSize:Point(1024,512)});
Bathymetry maps
These maps are large and contain sea depth lines also:
Colored, transparent white background:
Colored, land contours are black with green smudge, iso contour 500 yellow and each 1000 in orange, sea contours by 1000 m:
Colored, with sea filled: Sea shallow above 1 km depth is light blue,
sea above 3 depth km is middle blue, sea below 3 km depth is darker blue...
Depth profile of oceans
It's admirable, how precise are oceans filled with water...
If there was 1 km less water, the life from oceans could not climb to lands,
and if there was 1 km more water, there would be almost no lands...
On these images, the measure-line on left side shows depth/height of 1 km.
Ocean level is horizontal blue line...
Land on left is America, on center and right is Eurasia and Africa...
Note, that 30°N image has smaller vertical resolution due to Himalayas compressing image height: